

Andrew Cullen, The University of Melbourne
Music from Kylie Minogue, John Farnham, INXS, Midnight Oil, AC/DC, Tones and I, Gotye, Ben Frost, Nick Cave, Tame Impala, Parkway Drive, The Living End and Vance Joy has been found in a database of 12 million songs used to teach artificial intelligence.
This database, listing songs available on YouTube, is used by AI systems to train the ability to recognise and create music. AI relies entirely on these massive databases, trained on almost everything ever placed on the internet. And Australia’s inclusion in these databases is huge. Kylie alone has 182 songs in just one database.
The volume of Australian music used to train AI has caused significant anger in the Australian music industry, driven by the knowledge that “AI for music creators” platforms such as Suno create as much music as Spotify’s entire catalogue every two weeks.
Dobe Newton, co-writer of folk classic I am Australian and member of the Bushwackers, has music included in the databases. He believes there is “no real ethical nor moral underpinning” to current AI music practices.
Jesse Pattinson of The Delta Riggs is concerned about “the opportunity it will take away from real artists”. Screen composer and APRA board member Caitlin Yeo told me she holds “deep concern for the future of music made by humans for humans”.
She described feeling “violated” when discovering her work in these databases, realising decades of her work had been “hoovered up in a second” to “feed companies offshore that pay no taxes”.
While Australian artists are feeling ripped off, the intersection between copyright law and AI makes proving infringements incredibly difficult.
Copyright and AI
Lawsuits across multiple creative industries have covered how copyrighted books, speeches and even pornography have been used to train AI models.
These actions have led to massive settlements. In 2025, AI company Anthropic paid US$1.5 billion to writers who brought a class action lawsuit over the company’s use of a database of more than 7 million books to train its AI.
But when it comes to proving copyright infringement, the devil is very much in the details, and it may be harder for the impacted musicians to prove infringement than authors.
Crucially, these databases often do not contain any copyrighted material. Rather, they contain instructions on where to download the data from, along with associated information to help AI training.
Legal challenges
The distinction about how the databases are packaged up is not a minor thing.
Previous lawsuits surrounding similar databases found simply listing where copyrighted material can be found is not, by itself, copyright infringement. The infringement only takes place when an AI company uses the data to train its model.
Think of these databases like the map to a safe filled with gold. Having the map itself is fine; stealing the gold is when the law is broken. While we know at least some AI companies have used this data map, and that their training relies upon it, legally establishing use and any copyright infringements is a challenge.
This legal battlefield is complicated by the unique nature of music law.
Copyright protects specific expressions, like a distinct melody or recording, but not a general style. AI developers exploit this loophole. Rather than copying note-for-note, they extract underlying patterns, chord progressions and vocal textures to create a pastiche.
To a creator, this feels like theft. But in the eyes of the law it may just be imitation.
Legal challenges aren’t impossible. The German music royalties society successfully sued chatGPT’s OpenAI. Universal and Sony, representing more than 50% of the music industry, have sued Suno for infringing the copyright of more than 60,000 songs, following other cases against AI giant NVIDIA and Suno.
In response to these lawsuits, Suno described its platform as a fair-use training model, saying “learning is not infringing”.
What’s next?
Since artists became aware of these datasets, the international music industry has rapidly coalesced around several class action lawsuits and lobbying efforts. In Australia, 4,000 artists signed a petition calling on the government to increase protections for artists and today, artists held a press conference in Canberra to discuss AI’s impact.
Tech lobbyists are arguing for exemptions from Australian copyright law. Similarly the Australian Strategic Policy Institute argues that copyright law is a “strategic liability” that increases Australia’s reliance on foreign AI models.
There is a fierce tension between fostering innovation and protecting creative industries. But Australia does not have to choose between the two.
The European Union’s AI act forged an alternative path, to prevent AI companies from hiding copyright infringements from artists and rights holders.
From next August, all AI models accessed from within the EU must declare the source of their training data, and comply with local copyright laws, no matter where the AI was built.
These laws may break the veil of secrecy surrounding the AI data usage, and will significantly increase the likelihood of artists being paid when their work is included in these AI models.
The cultural heartbeat of Australia depends upon supporting creatives. Joining or drawing inspiration from the EU’s AI legislation could help protect artists, and ensure they are fairly represented regarding AI works derived from their labour.
At the very least, as Yeo told me, artists “should see a slice of the pie too”.![]()
Andrew Cullen, Senior Research Fellow, School of Computing and Information Systems, The University of Melbourne
This article is republished from The Conversation under a Creative Commons license. Read the original article.


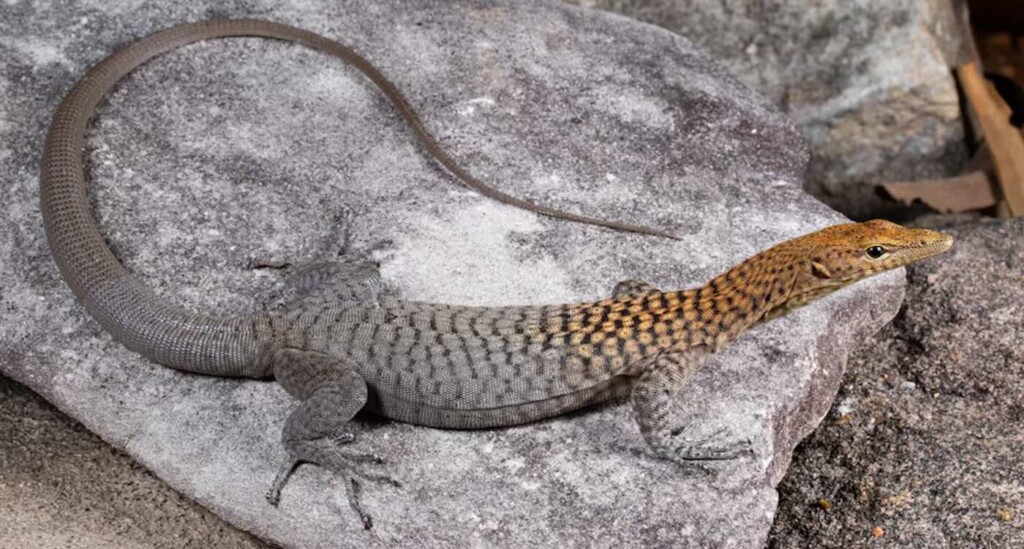 Orange-headed rock monitor lizard (Varanus umbra) on savannah in north Queensland -Supplied by Stephen Zozaya
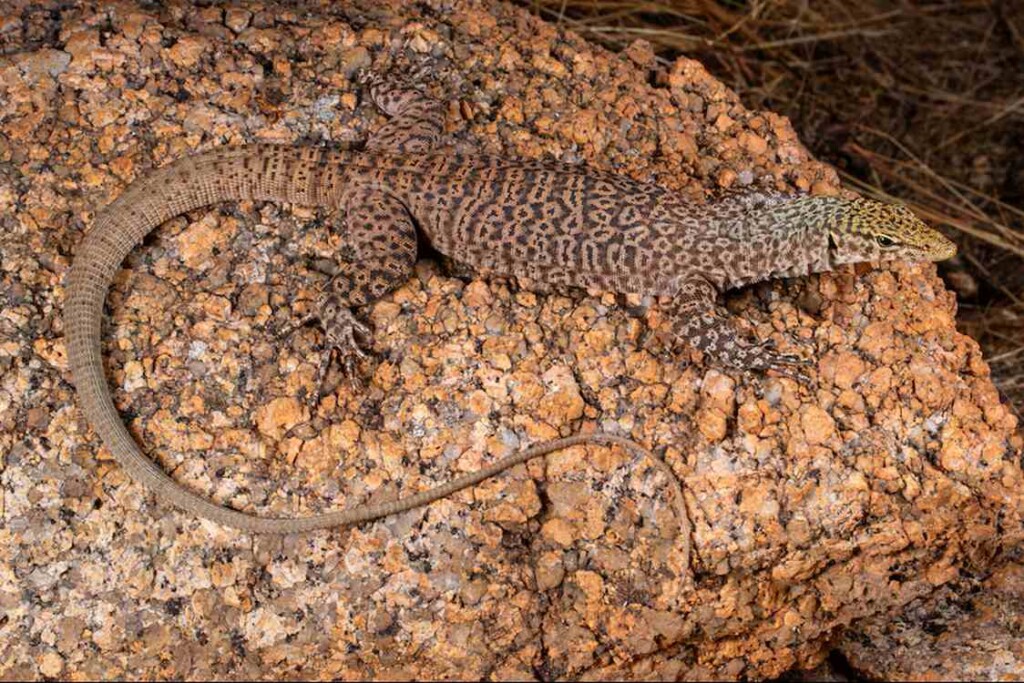 Varanus iridis, or the rainbow-headed rock monitor – credit, Dr. Stephen Zozaya


