

 Nour Wageh / Unsplash
Colin Caprani, Monash University and Scott Menegon, Swinburne University of Technology
Nour Wageh / Unsplash
Colin Caprani, Monash University and Scott Menegon, Swinburne University of TechnologyThe Great Pyramid of Giza in Egypt has survived more than 4,500 years. Earthquakes have repeatedly shaken the region, including the magnitude 5.8 Cairo earthquake in 1992, which dislodged some of the pyramid’s outer casing stones. Yet the main body remained essentially intact.
How has it survived so well? A new study of the pyramid’s vibrations by Egyptian geophysicist Asem Salama and colleagues provides insight into its performance during earthquakes, and identifies some interesting features.
But we should be cautious to conclude that its impressive longevity is proof of its builders’ knowledge of earthquake engineering.
What the research found
The researchers measured the pyramid’s vibrations in ambient conditions. They found that its natural frequencies – the frequencies at which it “prefers” to vibrate – are mostly between about 2.0 and 2.6 hertz (cycles per second). The surrounding soil has a much lower dominant frequency, around 0.6Hz.
Every structure has a natural rhythm. Push a child on a swing at the right moment and the motion grows; push at the wrong moment and little happens.
Buildings and monuments behave similarly. If earthquake shaking matches a structure’s natural frequency, the motion can be amplified. This is called resonance, and it can be catastrophic.
These findings suggest some behaviour that may be helpful during an earthquake, including a frequency mismatch between the pyramid and the soil. But they do not, by themselves, prove people intentionally built the pyramid to be resilient to earthquakes.
How the researchers measured it
The study used a method called horizontal-to-vertical spectral ratio analysis, or HVSR. This records tiny background motions from wind, traffic, human activity and natural ground vibration.
By comparing the horizontal and vertical components of these motions, researchers can estimate dominant frequencies in the soil and structure. In this case, instruments were placed at 37 locations in and around the pyramid, including internal passages, exterior stones and nearby soil.
The method provides useful information without damage. However, it only measures the response to small background vibrations, not the severe shaking of an earthquake.
The importance of frequency mismatch
When shaking from an earthquake happens at a frequency that matches a structure’s natural frequency, it can cause resonance. Resonance can be catastrophic.
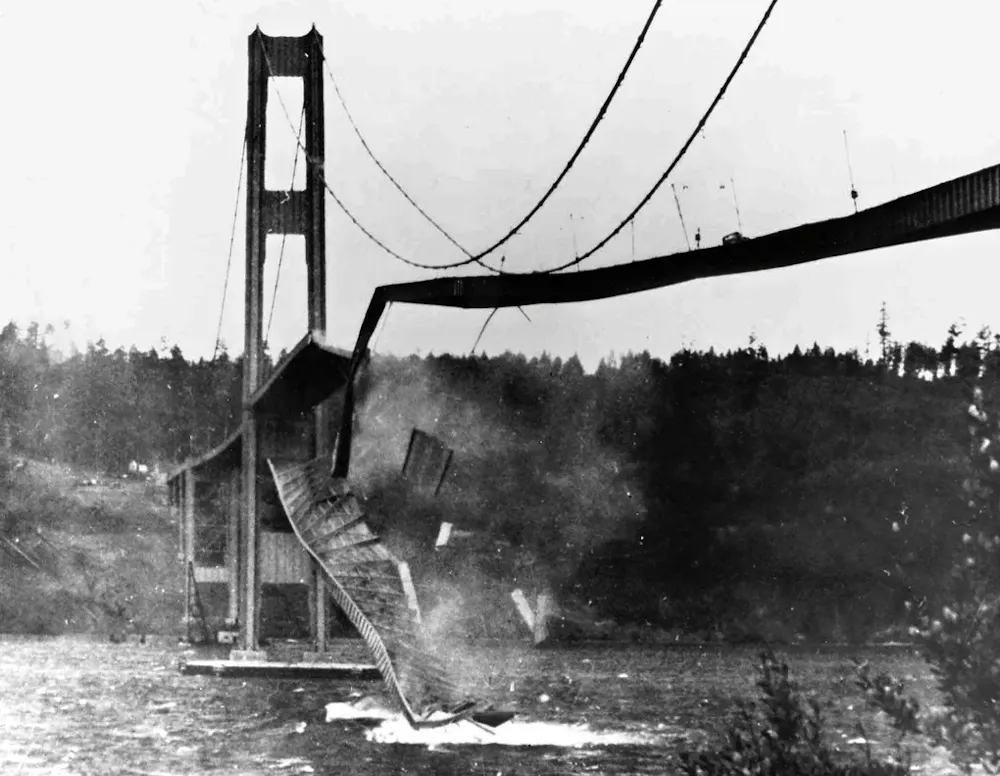 The 1940 collapse of the Tacoma Narrows bridge in the US is often attributed to resonance during high winds. Wikimedia
So the measured difference matters. If the ground and the structure vibrate at different rates, the ground is less likely to feed energy efficiently into the structure.
But this addresses only one possible mechanism of earthquake damage. There are plenty of examples of structures performing poorly in earthquakes, even though there was a frequency mismatch to the soil below.
Earthquake resilience is more complicated
Modern earthquake design does not assess resilience from one frequency comparison.
Instead, we look at a whole list of questions. How severe is the expected shaking? What ground is the structure on? How heavy and flexible is the structure? Can the structure deform and dissipate energy without sudden collapse? How serious would failure be?
The structure’s natural period or rhythm (which is related to its natural frequency) is part of that assessment. But it sits alongside many other factors.
In practice, earthquake damage depends not only on the earthquake but on the structures that receive it. Australia’s 1989 Newcastle earthquake, for example, was not huge by global standards, but many buildings fared poorly and 13 people died.
 Australia’s 1989 Newcastle earthquake wasn’t huge – but it caused great damage and 13 deaths. Australian Earthquake Engineering Society, CC BY
For the Great Pyramid, the behaviour of the stonework is especially important. Ambient vibration testing measures behaviour under very small motions. During strong earthquake shaking, masonry can crack, open joints, rock, slide and lose stiffness. Each of these changes the structure’s natural period, complicating the behaviour.
Beware survivorship bias
In evaluating the pyramid’s longevity, we should also consider survivorship bias.
Famously, in the second world war, statistician Abraham Wald was asked where armour should be added to aircraft. The obvious answer was to reinforce the places where returning aircraft had the most bullet holes.
Wald argued the opposite: those aircraft had survived. The aircraft that did not return were missing from the data.
 This famous diagram shows the pattern of bullet holes on returning aircraft in the second world war. Martin Grandjean / McGeddon (picture) / US Air Force (hit plot concept) / Wikimedia, CC BY
Ancient structures pose a similar problem. We admire ancient aqueducts, temples and pyramids because they are still here. The failed structures, poor foundations, weak details and abandoned experiments are mostly gone.
That does not diminish the Great Pyramid. It simply means looking at structures that survive today does not tell us everything about the design intentions behind them.
What the pyramid does teach us
The pyramid may not have been intentionally designed for resilience in an earthquake. But its survival is not an accident, either.
From an engineering point of view, it has many favourable features: a broad base, low centre of mass, tapering form, symmetrical plan, competent limestone foundation and massive masonry load path. It is squat, stiff and well-founded rather than tall, slender and flexible.
The safest conclusion is that the builders made excellent empirical engineering choices. Those choices may have been driven by construction experience, observation, structural necessity, or cultural intent. Their seismic benefits may be real without being the original purpose.
The Great Pyramid’s survival is not magic, and it is not proof of ancient seismic design. As evidence, this study is important and impressive, but incomplete.![]()
Colin Caprani, Associate Professor, Civil Engineering, Monash University and Scott Menegon, Senior Lecturer, Civil and Construction Engineering, Swinburne University of Technology
This article is republished from The Conversation under a Creative Commons license. Read the original article.


.jpg)
#/media/File:Tacoma-narrows-bridge-collapse.jpg)